The Social Security Administration (SSA) manages two federal disability programs: Social Security Disability Insurance (SSDI) for workers with sufficient employment history, and Supplemental Security Income (SSI) for individuals with limited income and resources. Timely decisions in these programs are critical for claimants, as delays can create financial and personal hardship.
This case study examines the most recent official data (through fiscal year 2024) on SSD claim processing times at all major stages: initial determination, reconsideration, and hearing appeals before Administrative Law Judges (ALJs). Using only government sources, including SSA performance reports, open-data dashboards, and oversight reports from the SSA Office of Inspector General (OIG) and the U.S. Government Accountability Office (GAO), we analyze both national trends and state-level disparities.
Executive Summary
As of 2025, Social Security Disability (SSD) wait times remain significant, but the Social Security Administration (SSA) is making real progress. According to SSA’s own reporting, the backlog of initial disability claims has dropped by 25 percent, from about 1.2 million to around 950,000 pending cases. Meanwhile, the number of pending disability hearings has reached a historic low of approximately 276,000, and average waiting times for hearings are about 60 days shorter than they were in mid-2024.
Methodology
This study relies entirely on official government sources, including SSA Annual Performance and Budget reports, SSA open-data dashboards, OIG audit reports, and GAO analyses covering fiscal years 2008–2024. Key metrics such as average processing times, pending caseloads, and state-level comparisons are drawn directly from these sources to ensure accuracy and avoid non-official interpretations.
Because the SSA publishes detailed annual performance and caseload data only after the close of each fiscal year, comprehensive 2025 statistics are not yet available. Fiscal year 2025 runs from October 1, 2024, to September 30, 2025, so final averages, backlogs, and processing times will only be fully reported in late 2025 or early 2026. Where possible, we supplement FY2024 data with mid-year updates, press releases, and OIG reports (e.g., July 2025 OIG audits or SSA press releases) to give the most current 2025 perspective, while clearly noting when figures are preliminary or estimates.
Terminology
- SSA – Social Security Administration: The federal agency that runs the disability programs.
- SSDI – Social Security Disability Insurance: Disability benefits for people with sufficient work history.
- SSI – Supplemental Security Income: Needs-based disability benefits for people with limited income and resources.
- DDS – Disability Determination Services: State agencies that review medical evidence and make disability decisions at the initial and reconsideration stages.
- FY – Fiscal Year: The federal budget year, running from October 1 to September 30.
- Initial Determination: The first disability decision made by DDS.
- Reconsideration: A second DDS review after an initial denial.
- ALJ Hearing (Hearing Level): A disability appeal decided by an Administrative Law Judge.
- Appeals Council: The SSA body that reviews hearing decisions upon request.
- Processing Time: The number of days it takes SSA or DDS to complete a case.
- Backlog: The number of pending cases that are awaiting a decision.
SSD Wait Times for Initial Disability Claims
The first stage of the SSD process, your initial determination, takes a long time right now. According to SSA’s FY2024 report, applicants waited an average of 231 days for their first decision nationwide. A few years earlier, this stage moved much faster: an SSA OIG audit shows the average was about 121 days in 2019, rising to 219 days in 2023. That’s an 81% increase in processing time from 2019 to 2023.
As claim decisions slowed down, the number of pending cases grew. SSA reported about 1.18 million initial claims waiting for a decision at the end of 2024, up from around 1.10 million the previous year.
Two major factors drove these delays: the pandemic and a sharp loss of experienced staff. The OIG notes that many Disability Determination Services (DDS) examiners left their positions, with attrition rates ranging from 13% to 25% per year. SSA’s FY2024 Agency Financial Report adds that the agency processed over 255,000 more initial claims in FY2024 than in FY2023, but the average processing time still increased to 231 days.
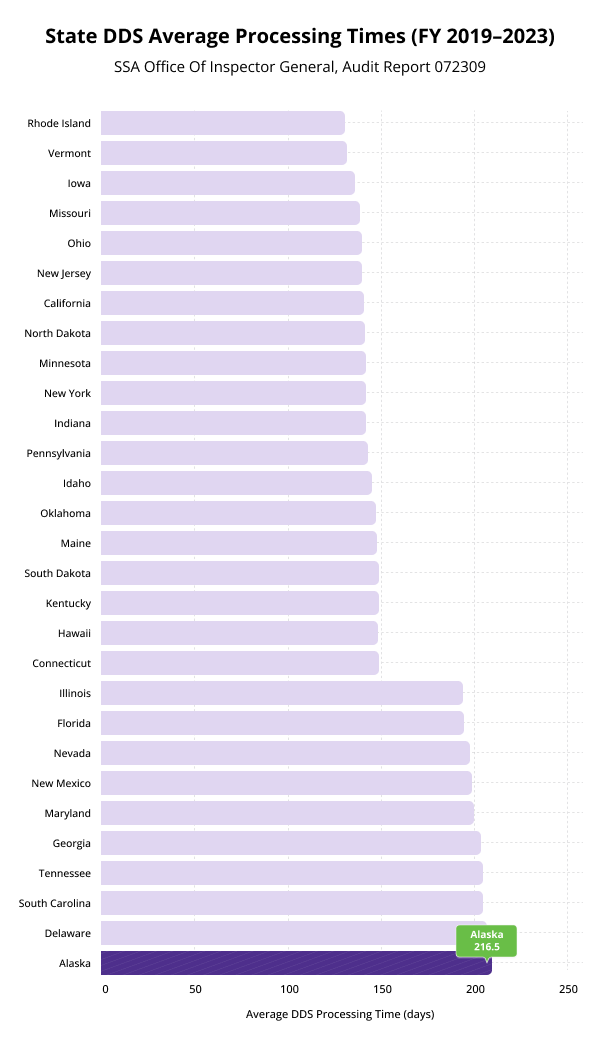
Processing times vary widely by state. The OIG audit shows the slowest states from FY2019–2023 included:
- Alaska: 216.5 days
- Delaware: 211.7 days
- South Carolina: 208.6 days
In contrast, some states processed claims much faster:
- Rhode Island: 124.6 days
- Vermont: 125.2 days
This means someone filing in Alaska waited about 1.7 times longer than someone filing in the fastest state. The OIG found that slower states often struggled to hire and keep experienced examiners, while faster states had far lower attrition and more stable staffing. These differences show how strongly state-level resources and staffing shape SSD wait times (oig.ssa.gov).
SSD Wait Times for the Reconsideration Stage
After most initial disability claims are denied, SSA requires the same state DDS to review the case again. This is called reconsideration, and it typically adds about as much time as the initial review.
SSA’s FY2024 data shows that reconsiderations took an average of 231 days, the exact same wait time as the initial claim stage.
Because many claims move from initial denial straight to a hearing request, the reconsideration process often does not speed up or slow down the overall journey. Instead, it simply adds another 6–8 months for anyone who must go through it.
SSA has announced plans to improve this step, but the current numbers show that reconsideration remains a major contributor to long SSD claim timelines.
SSD Wait Time for Hearing Appeals (ALJ)
If your claim is denied at the initial and reconsideration stages, the next step is to request a hearing before an Administrative Law Judge (ALJ). This is usually the longest part of the entire SSD process.
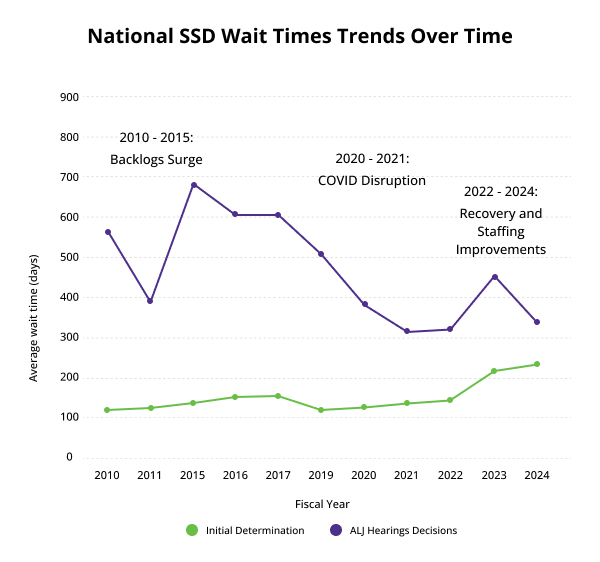
Historically, hearing delays were extremely high. A GAO study shows that the median time from initial filing to final hearing decision grew from 561 days for cases filed in FY2010 to 839 days for FY2015 filings. The hearing stage was the main reason for these long waits: the median wait just for the ALJ decision increased from 396 days (FY2011 filings) to 687 days by FY2016. For applicants who later appealed to the Appeals Council, that added even more time. Median processing rose from 383 days to 441 days between 2012 and 2015. To address these delays, SSA launched major backlog-reduction efforts, including the CARES plan beginning in 2016. By FY2019, hearing wait times had dropped noticeably. SSA’s average hearing decision time fell to about 506 days in FY2019.
OIG data confirms the trend: hearing processing times decreased from 543 days in FY2016 to 326 days in FY2021. The worst point was 605 days in FY2017, but wait times steadily declined afterward. The biggest improvement came in 2020, when the pandemic forced SSA to stop in-person hearings and shift procedures, which helped reduce the backlog. In FY2022, the average rose slightly to 333 days as SSA introduced new hearing formats.
The newest numbers for FY2023–2024 show continued progress. SSA reports that pending hearings dropped 19%, from about 322,000 to 262,000, between the end of FY2023 and FY2024. Average hearing time also fell from 450 days to 342 days in that same period. By September 2024, SSA’s processing charts show that closed cases averaged about 307 days.
A major milestone was reached at the end of FY2024: there were fewer than 275,000 pending hearings, the lowest level in nearly 30 years. SSA attributes this improvement to expanded video and telephone hearings, shifting cases to offices with smaller backlogs, and hiring additional ALJs.
Even with these gains, hearing waits remain slower than SSA’s goals. The FY2024 average of 342 days is still above the agency’s target of 270 days. In short, hearing wait times have improved dramatically from their peak but still generally take about a year as of 2025 (oig.ssa.gov; ssa.gov).
National SSD Wait Times Trends Over Time
SSD wait times have shifted a lot over the last 15 years. Here are the major patterns:
-
2010–2015: Backlogs Surge
After the Great Recession, disability claim filings increased sharply. DDS offices and hearing offices couldn’t keep up.
- Initial decisions got slower.
- Hearing waits became extremely long. GAO found the median wait hit about two years by 2015.
- Hearing backlogs reached over 1 million pending cases at their peak.
This period is widely viewed as the worst wait-time crisis in SSD history.
-
2016–2019: Reforms Start Working
SSA introduced its major backlog-reduction plan, CARES, which included more staffing, case transfers, tele-hearings, and dozens of efficiency initiatives.
- Hearing backlogs began to shrink.
- By FY2019, the average hearing decision time dropped to around 506 days (gao.gov).
- Initial claims stabilized, and SSA aimed to keep initial processing under about 220 days (though the agency didn’t always meet this goal).
Overall, this period marked a steady improvement from the 2010–2015 crisis.
-
2020–2021: COVID Disruption and Temporary Declines
The pandemic forced SSA to close offices in early 2020. In-person hearings stopped completely, and SSA quickly moved to video and phone hearings.
- This temporarily pushed hearing times down (from 506 days to 386 days) (oig.ssa.gov).
- But initial claims suffered: fewer claims were filed in FY2020 (2.13M vs. 2.28M in 2019), yet staffing losses and examiner attrition caused delays. DDS production dropped 15% and processing times jumped 81% between FY2020 and FY2023 (oig.ssa.gov).
SSA responded by setting new goals, such as deciding 92% of older pending claims by FY2025 (ssa.gov).
-
2022–2024: Slow Recovery
SSA rehired staff, expanded remote-hearing options, and added more technology tools. Progress was uneven but noticeable. SSA’s FY2024 Agency Financial Report found that:
- The hearing backlog fell 19% from FY2023 to FY2024.
- Average hearing waits settled around 300–340 days, better than the crisis years but still above SSA’s target of 270 days.
- Initial claim wait times grew to about 231 days in FY2024, largely due to the pandemic-era backlog and continued staffing shortages.
By FY2024, wait times (231 days initial, 342 days hearing) were much better than the 2017 highs, but worse than the 2018–2019 levels. SSA continues expanding case-tracking technology, customer-service improvements, and expedited processing for critical cases in an effort to bring these times down.
SSD Wait Times: a Comparison by State
State-level comparisons reveal persistent disparities in SSD wait times. The SSA OIG’s July 2025 audit highlights that in recent years some DDS offices are far slower than others.
For initial claims, the slowest states (2019–2023 average) were Alaska, Delaware, South Carolina, and Tennessee (all ~200+ days), while the fastest were Rhode Island, Vermont, Iowa, and Missouri (~125–135 days).
These differences largely mirror staffing: the high-wait states reported extreme examiner attrition and hiring challenges, whereas the low-wait states had stable experienced staffs. For hearings, there is less public breakdown by state, but GAO and OIG note that some hearing offices (e.g. in Appalachia and the Northeast) historically had much longer queues than others.
Looking Ahead: SSD Wait Times in 2025
As of 2025, SSA’s efforts to reduce SSD wait times are gaining real traction. According to a July 2025 SSA press release, the backlog of initial disability claims has fallen by 25%, down to around 950,000 pending cases from over 1.2 million. Hearing backlogs are also at a historic low (about 276,000 pending), and average wait times have improved by roughly 60 days since mid-2024 (ssa.gov).
Behind these improvements is a clear plan: SSA’s FY 2025 budget includes increased funding for DDS staffing (to restore and retain examiners), more hearing office staff (to hit a target of 270-day average wait), and nearly $1.7 billion for IT modernization. At the same time, SSA is expanding its digital-first customer services, improving its online portal, reducing field office wait times, and making its 800-number system more efficient (ssa.gov).
That said, the path forward is not risk-free. The OIG and other observers warn that turnover in DDS remains a serious threat. And independent analysts note that part of the backlog reduction may reflect a decline in approval rates, raising concerns about access for some applicants (Urban Institute).
If SSA can sustain its hiring pace, continue investing in technology, and keep its operational reforms on track, it may finally deliver more timely decisions for disability applicants. But success will depend on maintaining these commitments, especially when it comes to staffing and funding.
Sources
- Social Security Administration – Open Data: Combined Title II Disability and Title XVI Blind/Disabled Average Processing Time: https://www.ssa.gov/open/data/Combined-Disability-Processing-Time.html
- Social Security Administration – Open Data: Initial Disability Cases Involving Processing Centers Average Processing Time: https://www.ssa.gov/open/data/program-service-centers.html
- Social Security Administration – Open Data: Disability Reconsideration Average Processing Time: https://www.ssa.gov/open/data/disability_reconsideration_average_processing_time.html
- Social Security Administration – Open Data: Average Processing Time Until Hearing Held: https://www.ssa.gov/open/data/Average-Proc-Time-Until-Hearing-Held.html
- Social Security Administration – Annual Performance Report (FY 2024): https://www.ssa.gov/agency/performance/materials/2024/SSA_FY24_APR.pdf
- Social Security Administration – Annual Performance Report (FYs 2023–2025): https://www.ssa.gov/agency/performance/materials/2025/SSA_FYs2023-2025_APR.pdf
- Social Security Administration – FY 2024 Agency Financial Report (Other Information): https://www.ssa.gov/finance/2024/Full%20FY%202024%20AFR.pdf
- SSA Office of the Inspector General – Audit Report: The Social Security Administration’s Hearings Backlog and Average Processing Time (A-05-22-51159): https://oig.ssa.gov/assets/uploads/a-05-22-51159r.pdf oig.ssa.gov+1
- SSA Office of the Inspector General – Report: Disability Determination Service’s 21 Percent Productivity Decrease and 81 Percent Increase in Processing Times: https://oig.ssa.gov/news-releases/2025-07-18-disability-determination-service%E2%80%99s-21-percent-productivity-decrease-and-81-percent-increase-in-processing-times-coincided-with-the-loss-of-key-technical-staff/
- Social Security Administration – Hearing Office Average Processing Time Ranking Report, FY 2024: https://www.ssa.gov/appeals/DataSets/archive/05_FY2024/05_August_Average_Processing_Time_Report.html
- Social Security Administration – Annual Performance Plan / Annual Performance Report page: https://www.ssa.gov/agency/performance/